FAQ
Please find answers to frequently asked questions on this page. If they don't answer your questions, please do not hesitate to contact us.
General
Absolutely not. You don’t need to write a single line of code or know any bioinformatic tools to run an analysis. Our fully automated pipelines take care of that. You can see a video of how to use our platform here. Basic understanding of bioinformatic concepts does help understand the results better. You can find some articles on those topics here.
All your need is the FASTQ files provided by your core facility or sequencing provider. They are files ending with .fastq.gz, or.fq.gz. Other than that, you will have to input basic information such as sample names and organism of interest.
Your data is stored in Amazon Web Services (AWS) Simple Cloud Storage (S3). Your data is protected by industry standard security features provided by AWS. Aladdin will only access your data for the purpose of troubleshooting. No other user has access to your data. Your data will be deleted completely from AWS S3 when you delete your samples or your analysis results.
You can see a list of available bioinformatic pipelines here. Each pipeline lists what type of NGS data it is compatible with. We are constantly expanding our bioinformatic pipelines catalog, so if you don’t see the pipeline that suits your needs, please check back later or let us know what type of pipelines you would like to see.
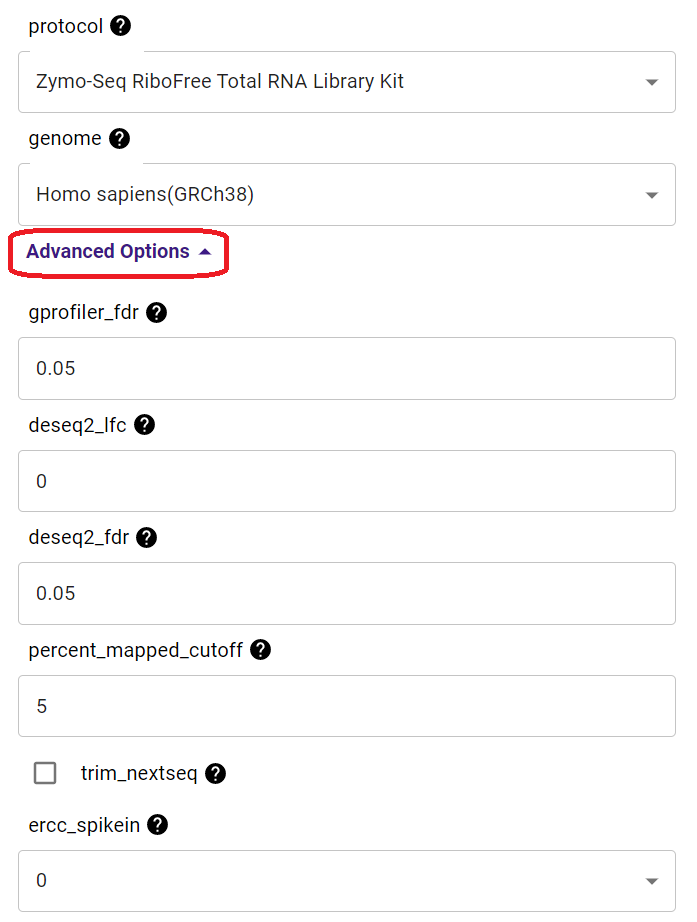
Each analysis has several common options that you can customize, such as reference genome, etc. They often have other parameters that have default values. You can see and modify them by clicking “Advanced Options” button at the end of analysis page.
All pipelines on the Aladdin platform produce a report. You will often get overall statistics, quality control plots, and statistical analysis results, all in the report, ready for you to examine and explore. In addition to the report, you can download result files and publication-quality plots to power your further research. Each of our pipelines has a sample report. Please check out the pipelines page for the sample reports.
Usually, you can expect your results within a day after you submit an analysis. Sometimes though, there may be unexpected difficulties involved in the analysis. For pipelines we provide tech support with, we will be working hard to manually resolve those. In those cases, it will take a little longer, but you should still expect your results in a few days.
Sure. Each of our pipelines comes with a documentation about the report (click “Report Documentation” under each pipeline on the pipelines page. Please refer to that to help you understand the report. If you still need help, feel free to contact us and we are happy to help!
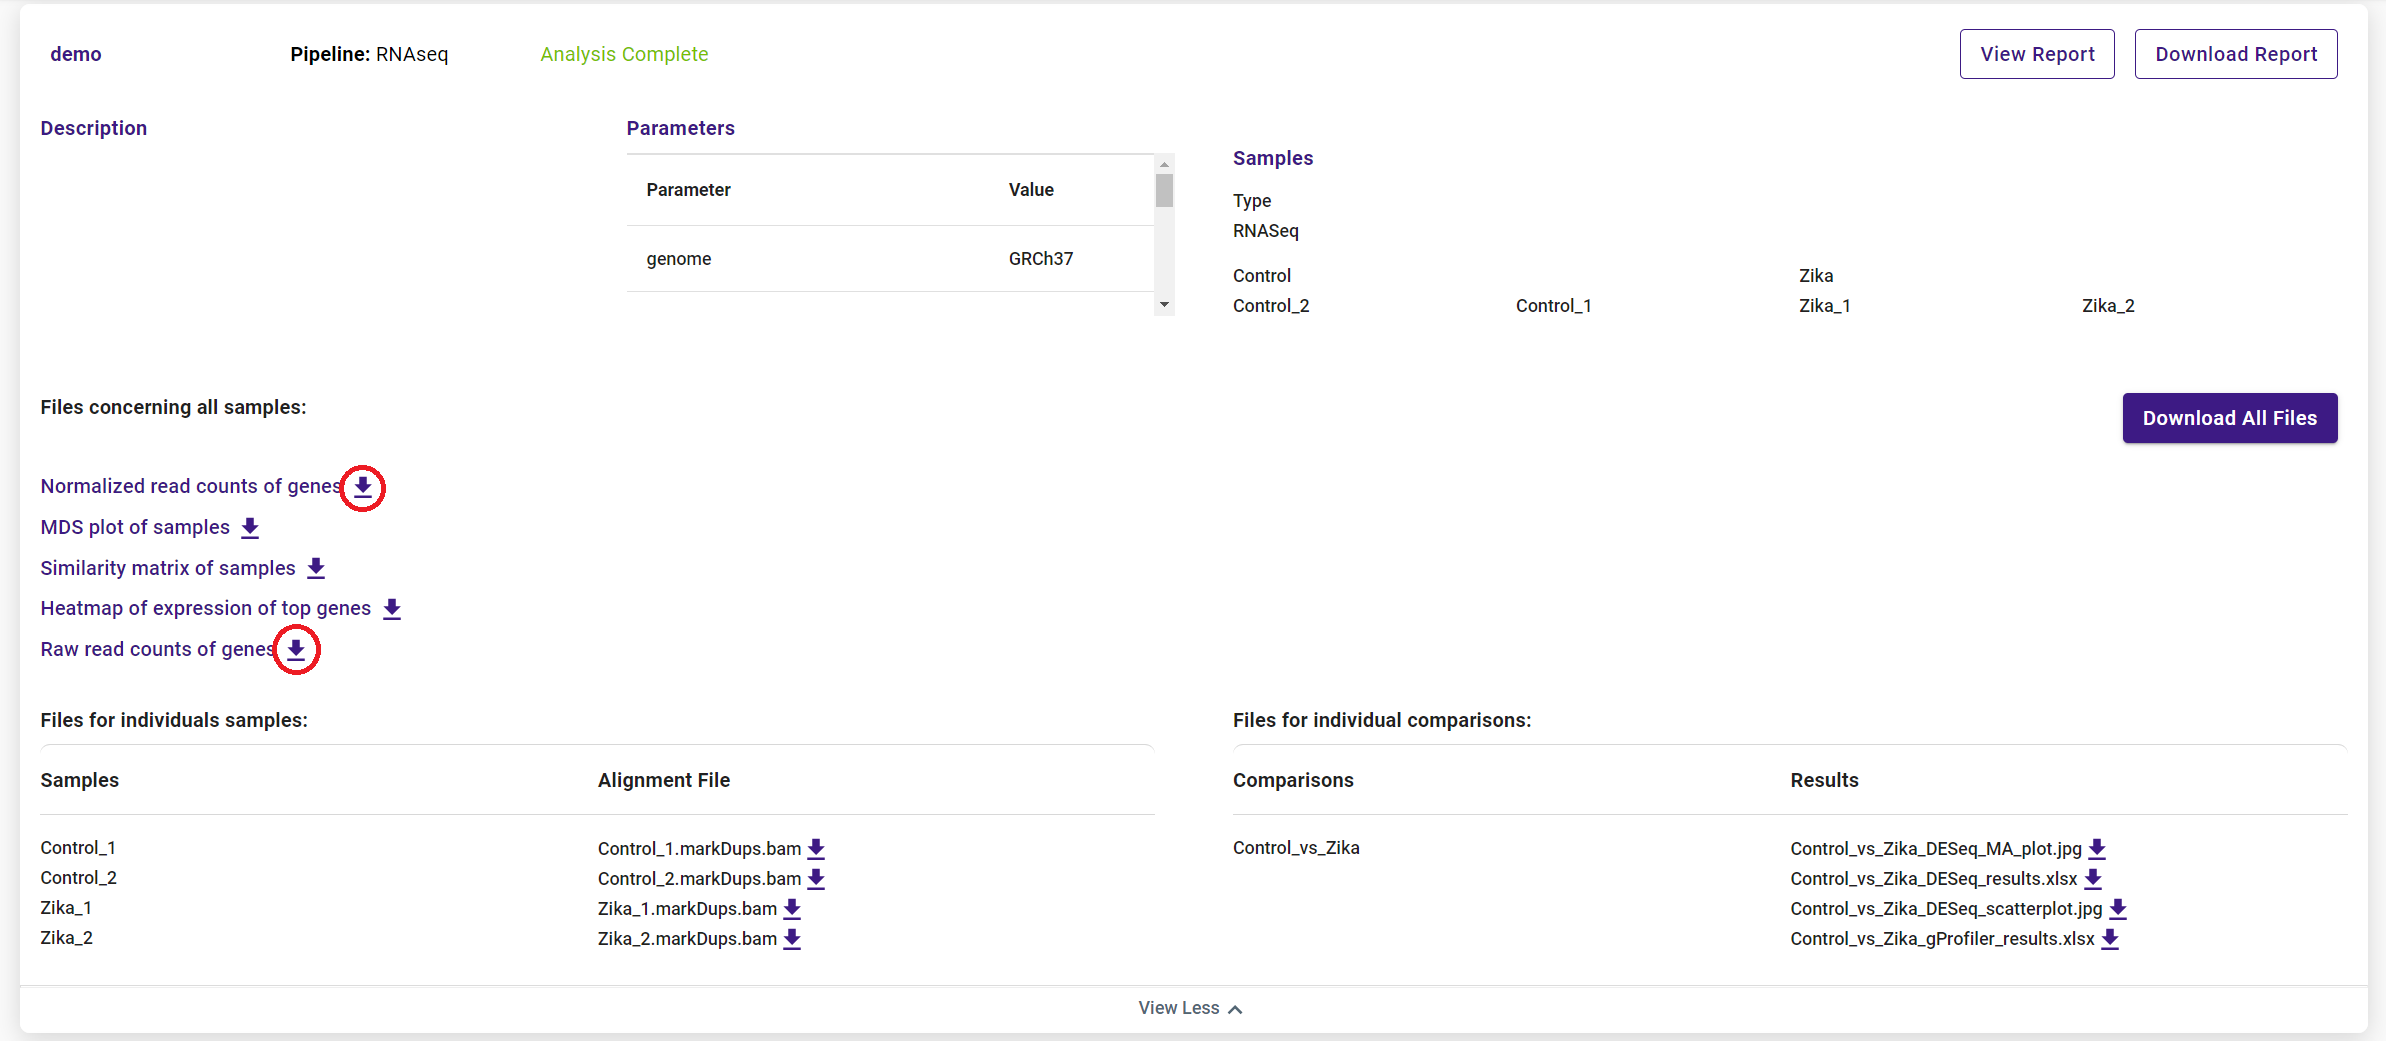
Downloading your results is easy. Simply click the “Download Report” button, the download icon next to the file you want, or the “Download All Files” button, and your files will download via your browser. Please note “Download All Files” button only includes files smaller than 1G.
Sure. The GitHub page of each of our pipelines often has a “Method and Materials” template document that can help you with that. If you can’t find that, please contact the author of each pipeline.
Bioinformatics
Of course! Transparency instills confidence. All current pipelines on Aladdin are open sourced. You can see the source code of all piplines by checking “Source Code” under each pipeline on the pipelines page. We also invite you to contribute to them. Some of our pipelines were adapted from community-created pipelines. Let’s work together to make bioinformatics better and easier for everyone.
The “General Statistics” table is a great place to start with as it provides general metrics about the data quality as well as some basic data output. For detailed guidelines, please click “Report Documentation” under each pipeline on the pipelines page for more thorough instructions.
For pipelines that generate a MultiQC report, at the top right corner of the chart you are downloading, you will find a button, “Export Plot”. Click on it and you will see the navigation bar for exporting both images and data used to make the images! For other pipelines, it depends on how the report is generated, but you often can save a copy of the plots by right clicking on them.
You can do it in two ways! One is to export the data as mentioned in the question above and plot them as you see fit; this other is to export the plot in “SVG” format (Select “SVG” in the drop-down box right next to “Aspect ratio” in the “Export Plots” navigation bar after you click on “Export Plot”) You can then use a vector graphics editor such as Inkscape® or Adobe Illustrator® to edit the aesthetic features.
Not yet, but soon. We believe there are so many awesome bioinformatics tools/pipelines in the community, and they should be accessible to all researchers. The Aladdin platform supports any pipeline written in Nextflow with a few minor requirements. We will let you know once we finalize the standard guideline for sharing your pipeline.
RNAseq
The RNAseq pipeline consists of the following analyses: Raw read QC, Adapter trimming, Alignment, Sample level QC for library qualities and biotype composition analysis, Gene counting, Sample similarity comparison, Differential gene expression analysis, and Gene set (pathway) enrichment analysis. You can see a sample report here.
You can find a list of supported species in the drop-down menu when you start a new analysis. If your species of interest is not on the list, you can submit your analysis with a custom request.
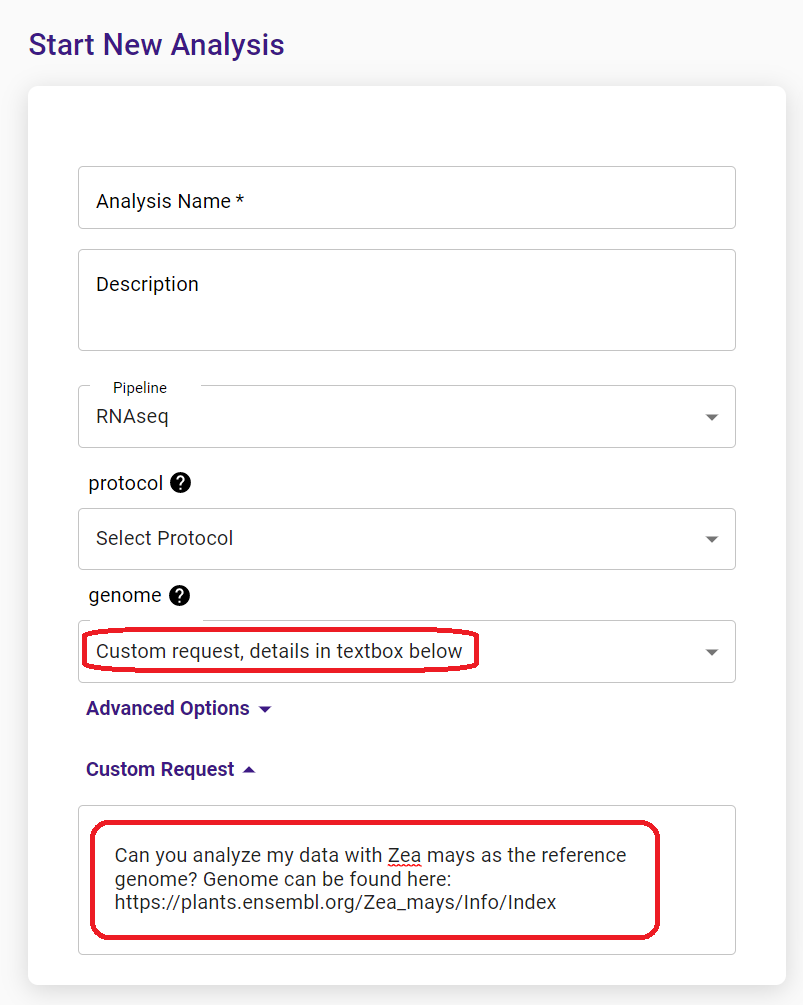
Alternatively, please contact us to request adding your species to the supported list.
You can find a list of supported kits in the drop-down menu when you start a new analysis. If your library prep kit is not on the list, you can submit your analysis with a custom request.
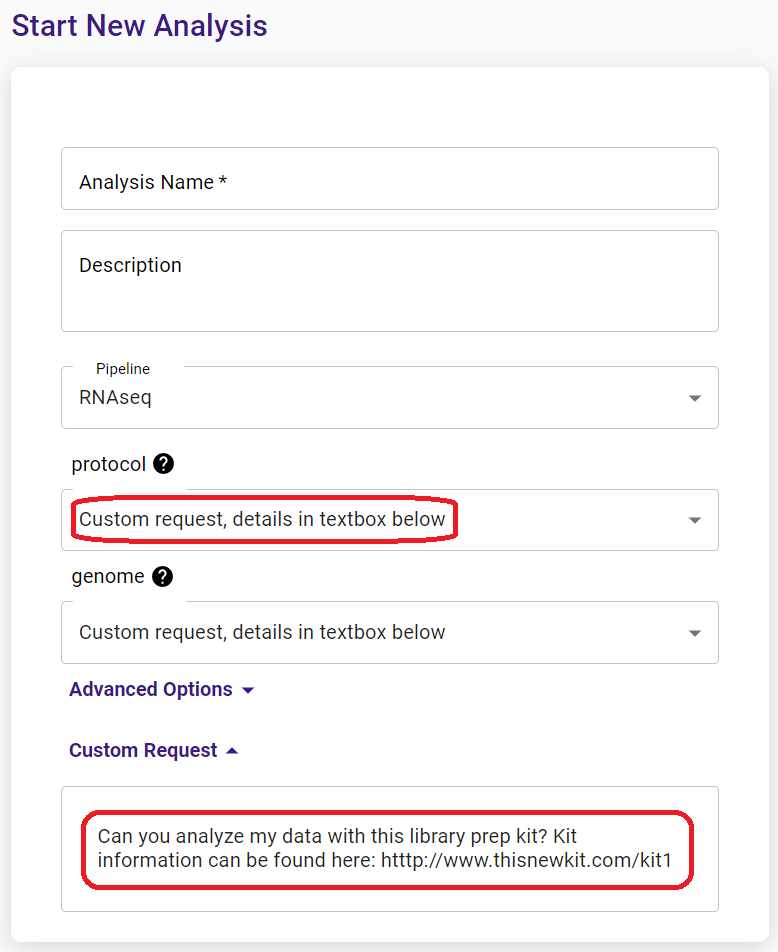
Alternatively, please contact us to request adding your kit to the supported list.
Yes. When you start a new analysis, please expand the “Advanced Options” tab, and you will see a list of parameters that you can customize for your analysis.
You can download either raw or normalized read counts from the results page of your analysis.